Trading Helper 0.3.0-dev
Hey folks,
in the last weeks I worked on overhauling the UI of the Trading Helper tool which I want to publish now before going on vacation for a couple days with my family.
Most significantly this update contains the following changes:
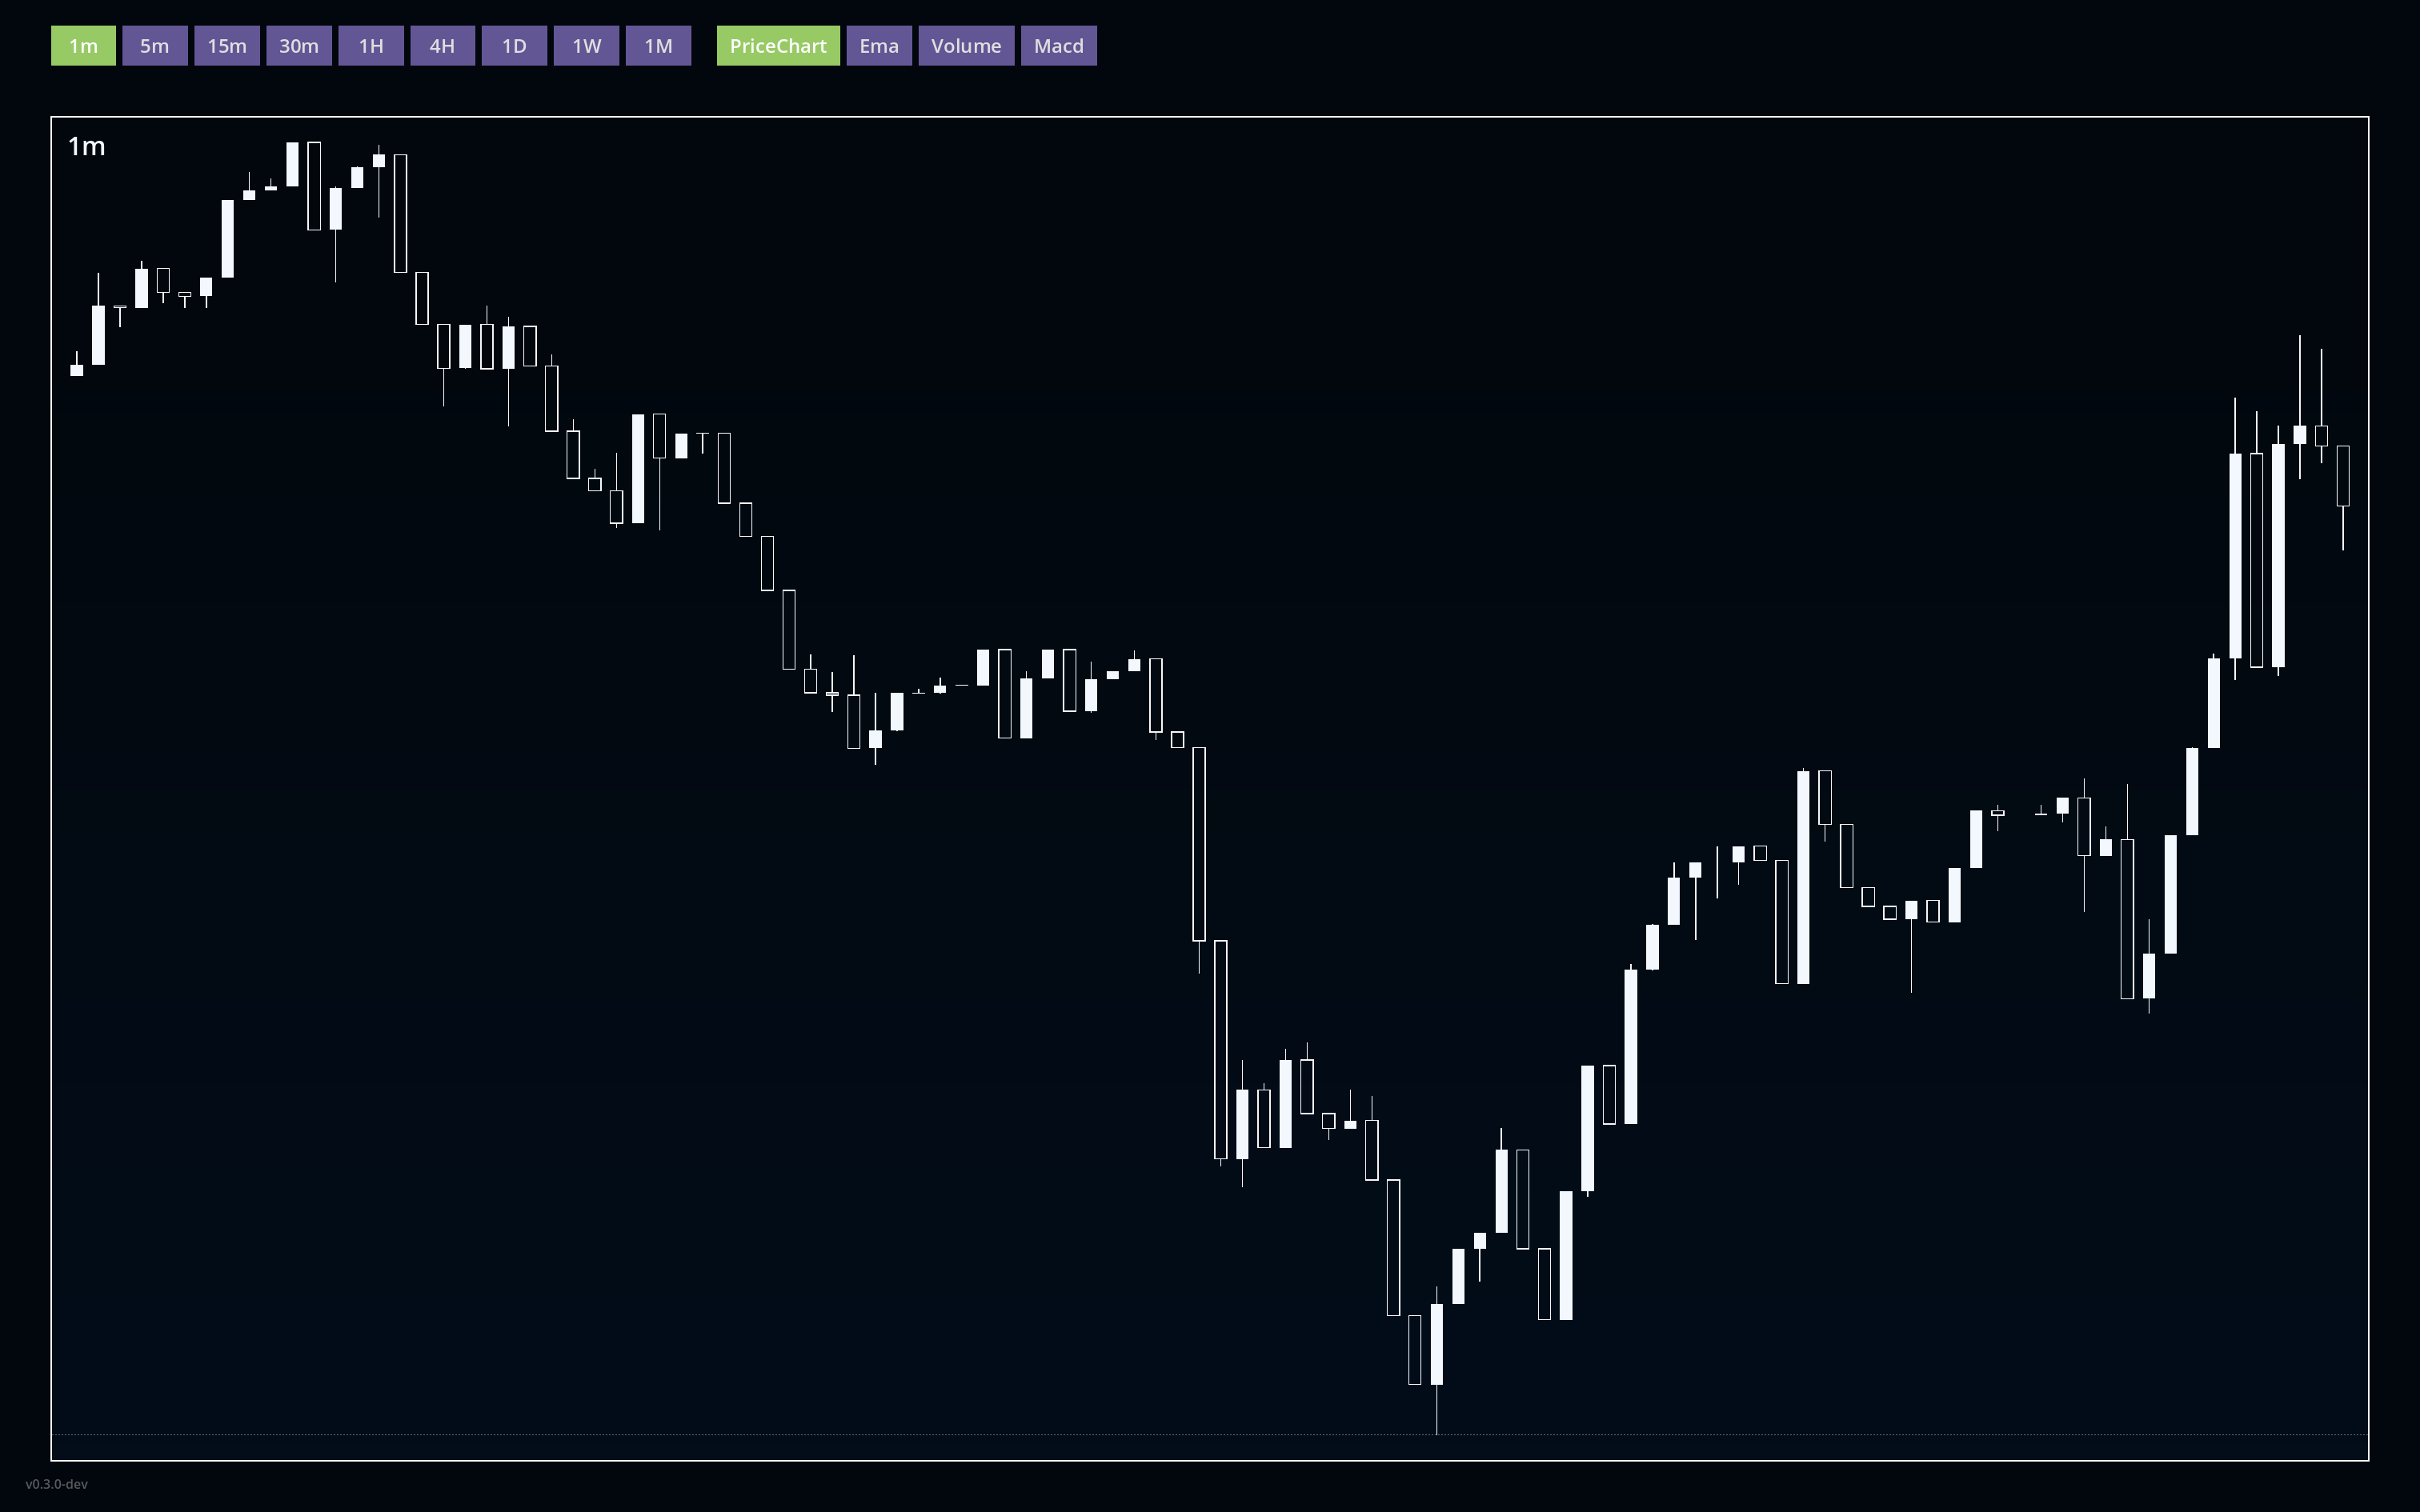
- the chart is now an actual candlestick chart instead of a line chart which it has been before
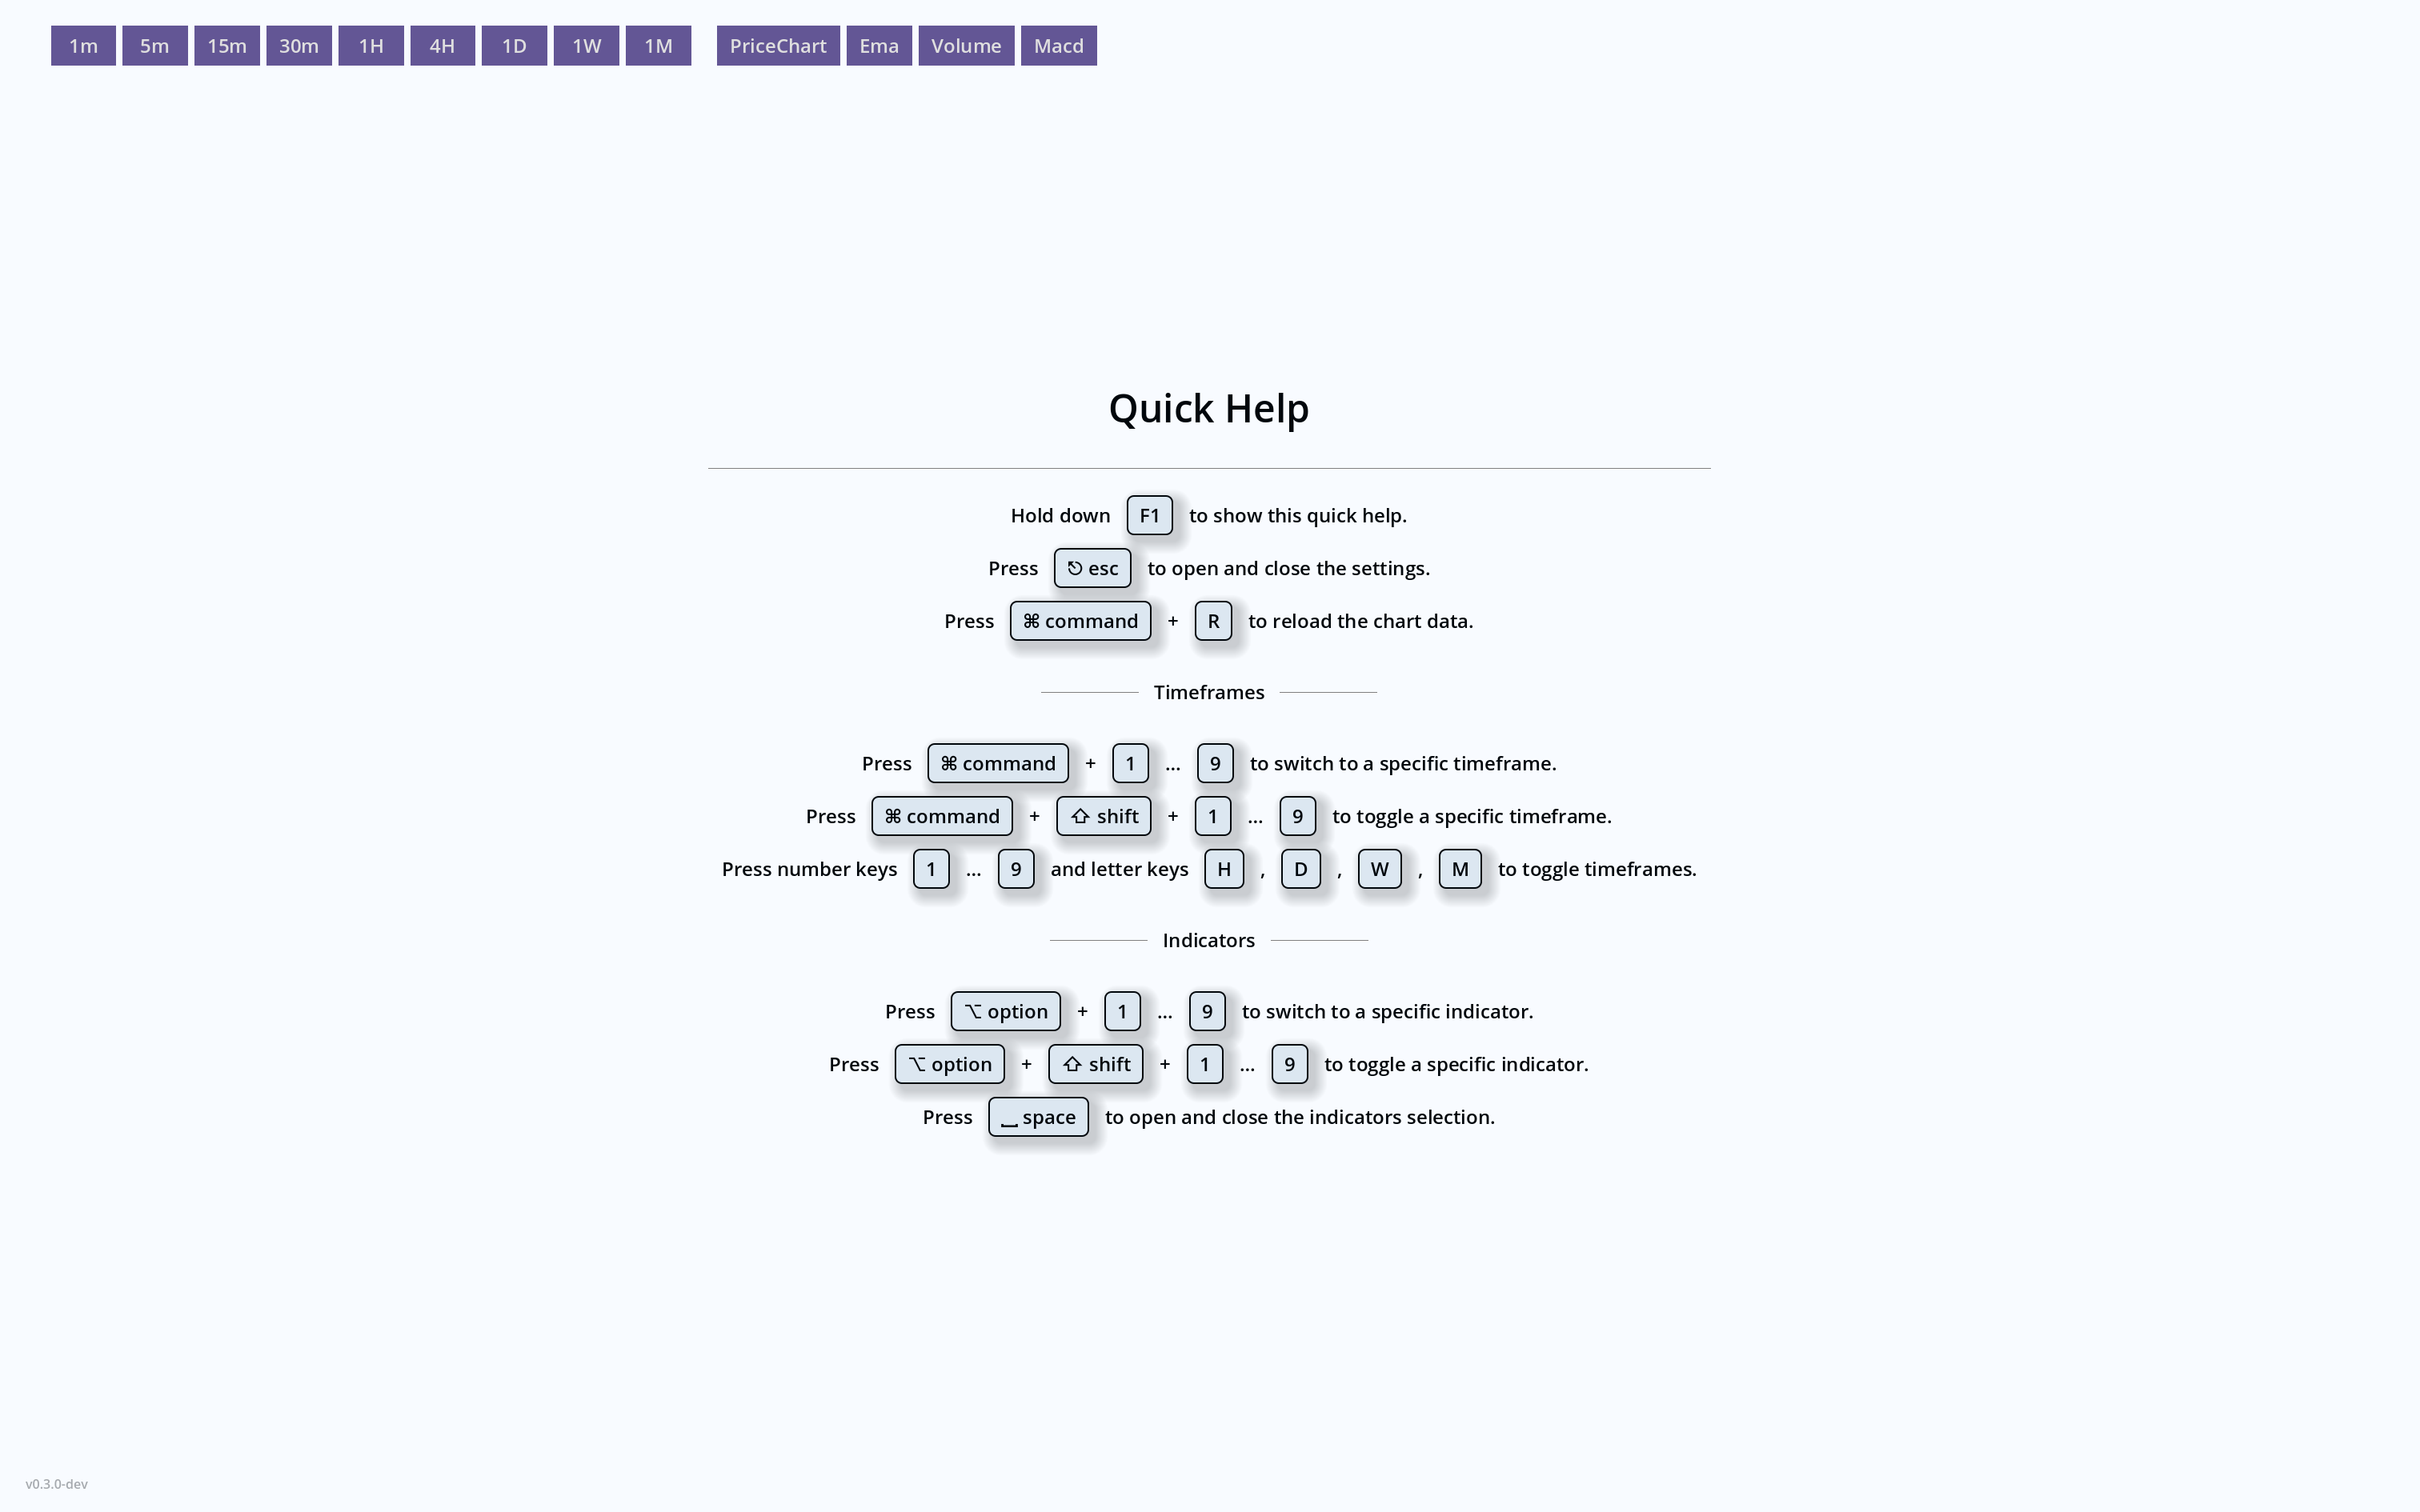
- there are new shortcuts for switching/toggling the active timeframes and indicators
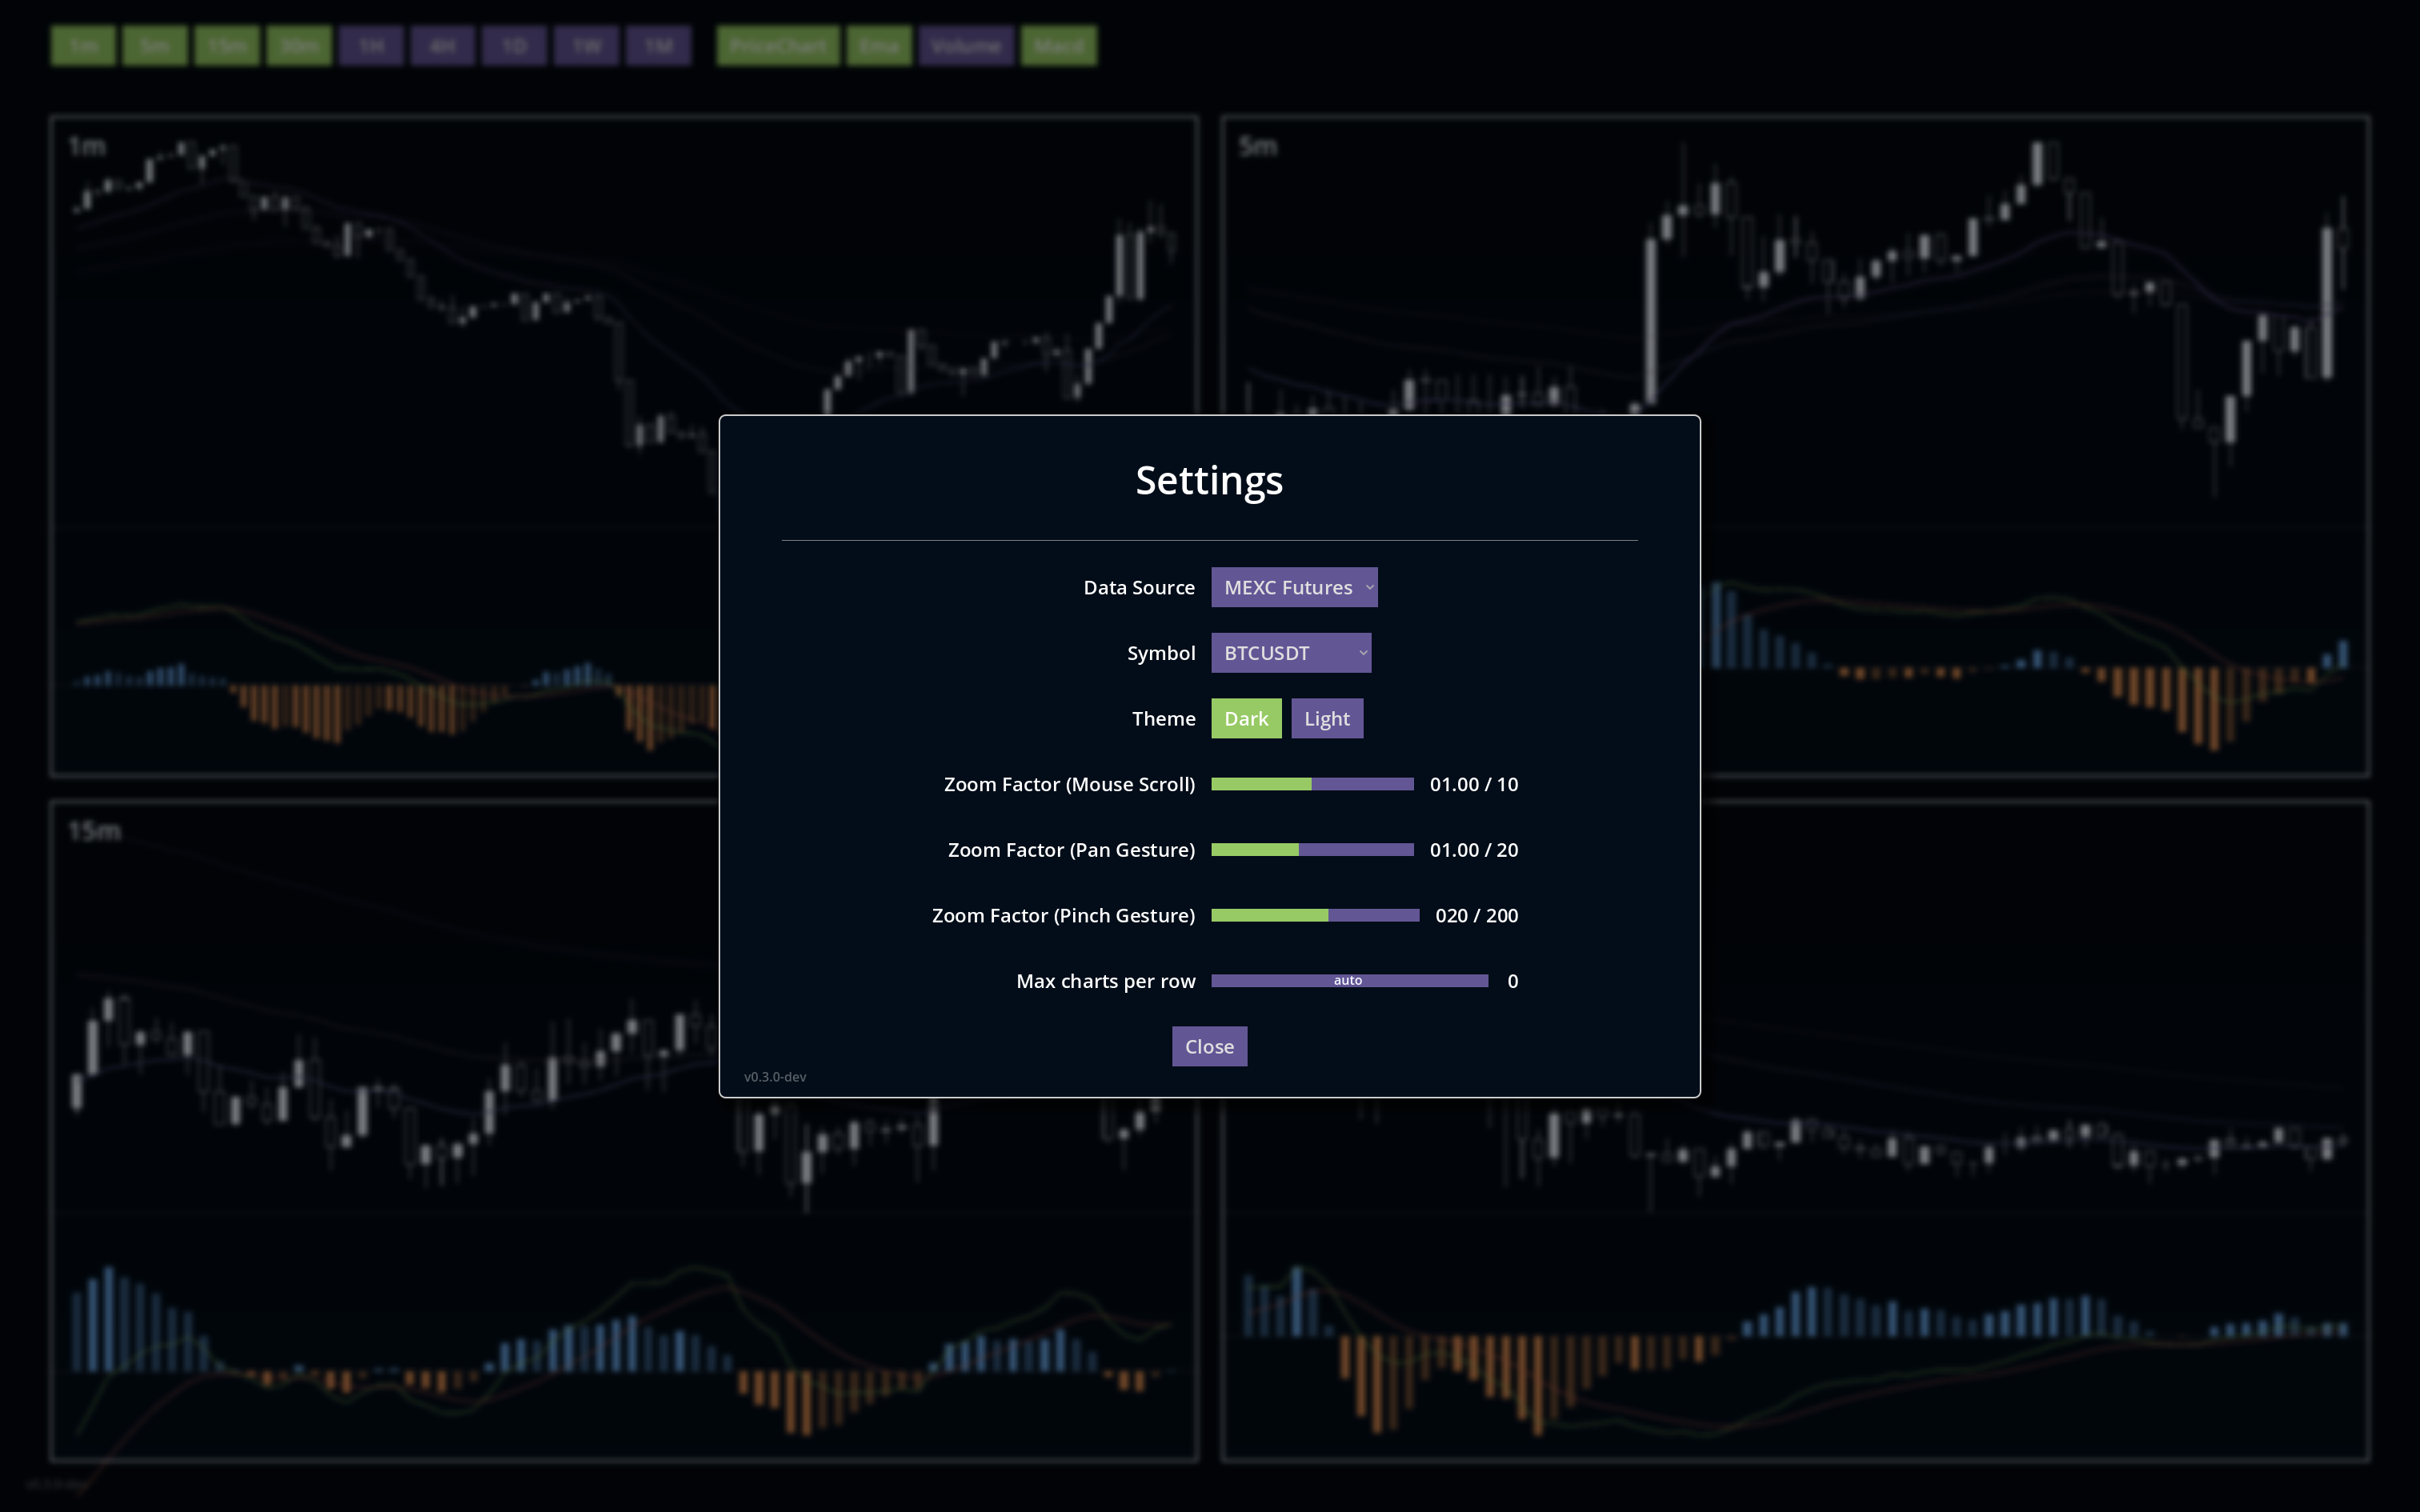
- there’s now (additionally and optionally) a popup menu as known from tradingview.com for selecting timeframes
- there’s now a popup menu for selecting indicators that should be visible in the top button bar
- in the settings you will find a new option for switching to a light theme
There are still some known bugs and also there are a few open todos left under the hood which is why I marked this release as “dev” release rather than “alpha” or “pre-release” or “rc” or something like that.
In the frontend there won’t change a lot until the final 0.3.0 release, though. You should be fine with using this *-dev release regardless of what might yet happen below the surface for the 0.3.0 release.
Hope you like the changes in the Trading Helper so far. There are more to come in the future. I am not yet done with that tool and the backlog of my kanban board is full of tasks and ideas. Stay tuned, though it probably will take a while until I can get really close to what I have in mind for the tool.
Have a good one.
Arvid.
Files
Get Trading Helper
Trading Helper
A small tool displaying condensed information for helping with trading crypto currencies.
| Status | In development |
| Category | Tool |
| Author | Arvid ☠️ |
| Tags | chart, crypto-currency, mexc, Trading |
| Languages | English |
Comments
Log in with itch.io to leave a comment.
Awesome, is there any way you can add a draw trend line simulation type of game on past historical data? I need to practice trend lines, and I am learning to day trade as well. Perhaps we can team up :)
Hey, thanks for your interest in my tool! ❤️
My plans are a bit different from replacing TradingView where you can already do exactly that: Draw anything into the charts easily.
So, for drawing trend lines and orderblocks and whatnot into the chart I highly recommend to signup at tradingview.com and to use that rather than my tool. No worries, TV is usable for free (although there are some limits for free accounts) and it’s totally sufficient to learn the basics and to walk your first steps in trading and especially to do your chart analysis. It’s perfect for that already.
That’s not what I expect from my tool.
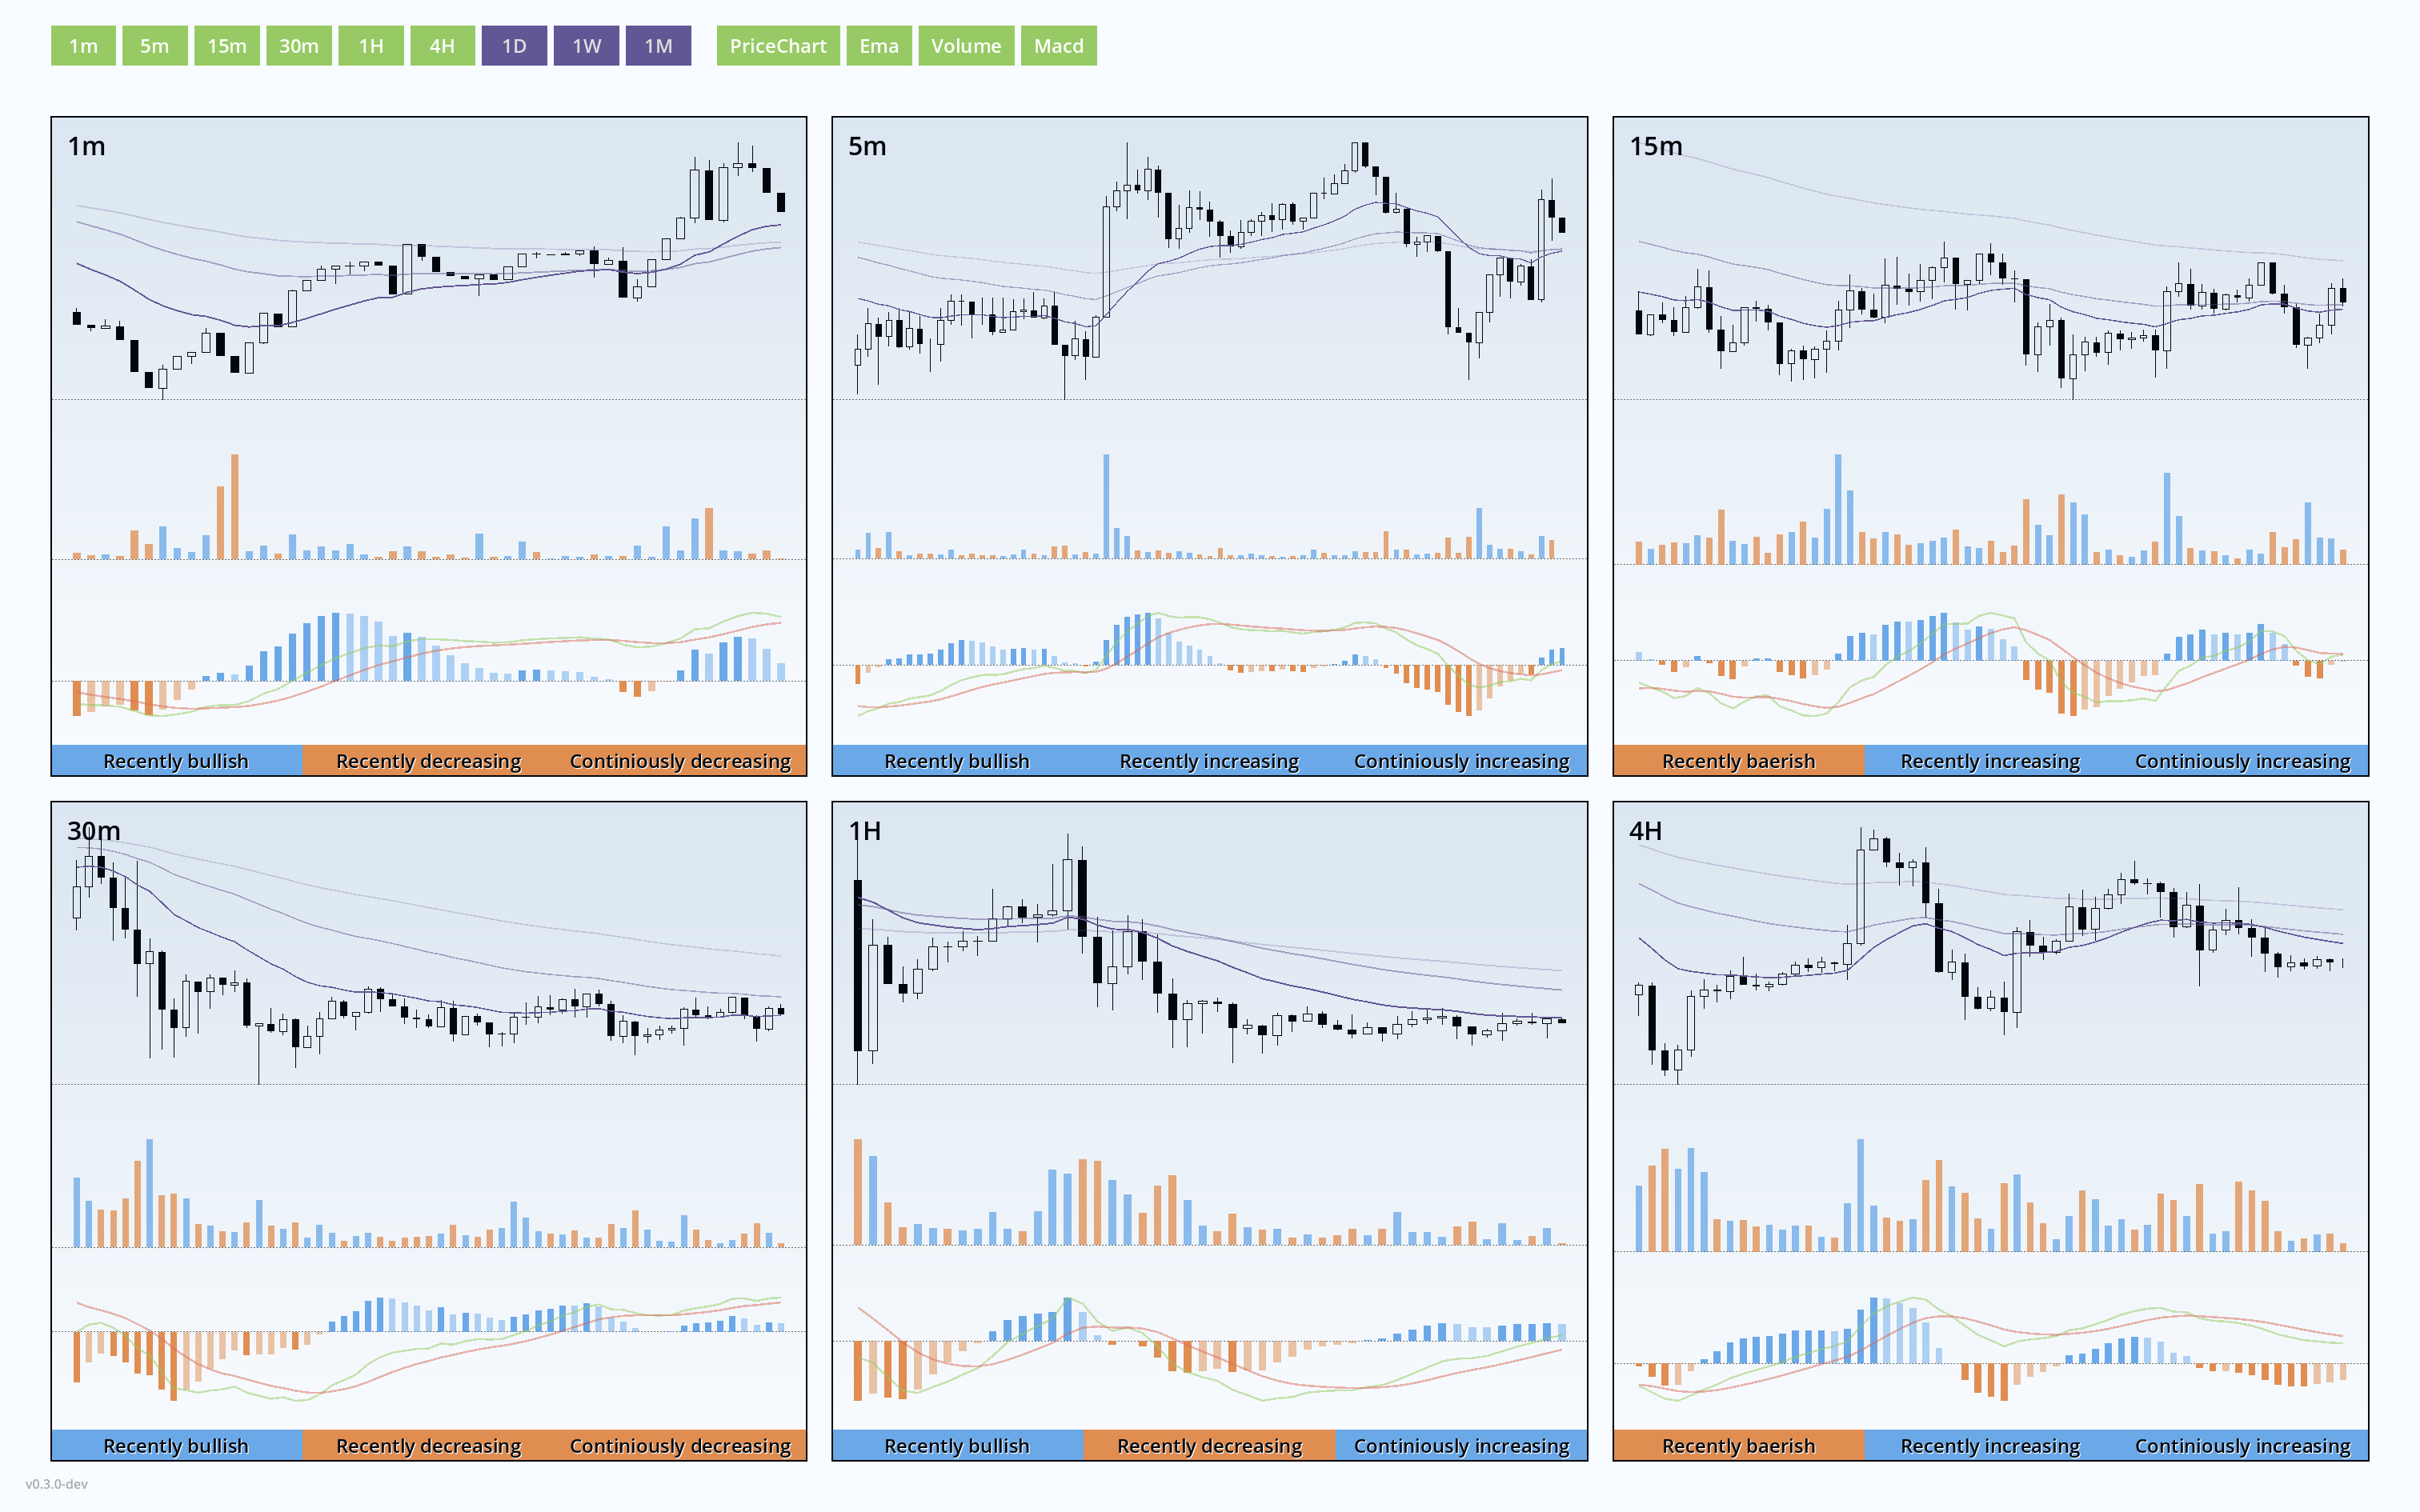
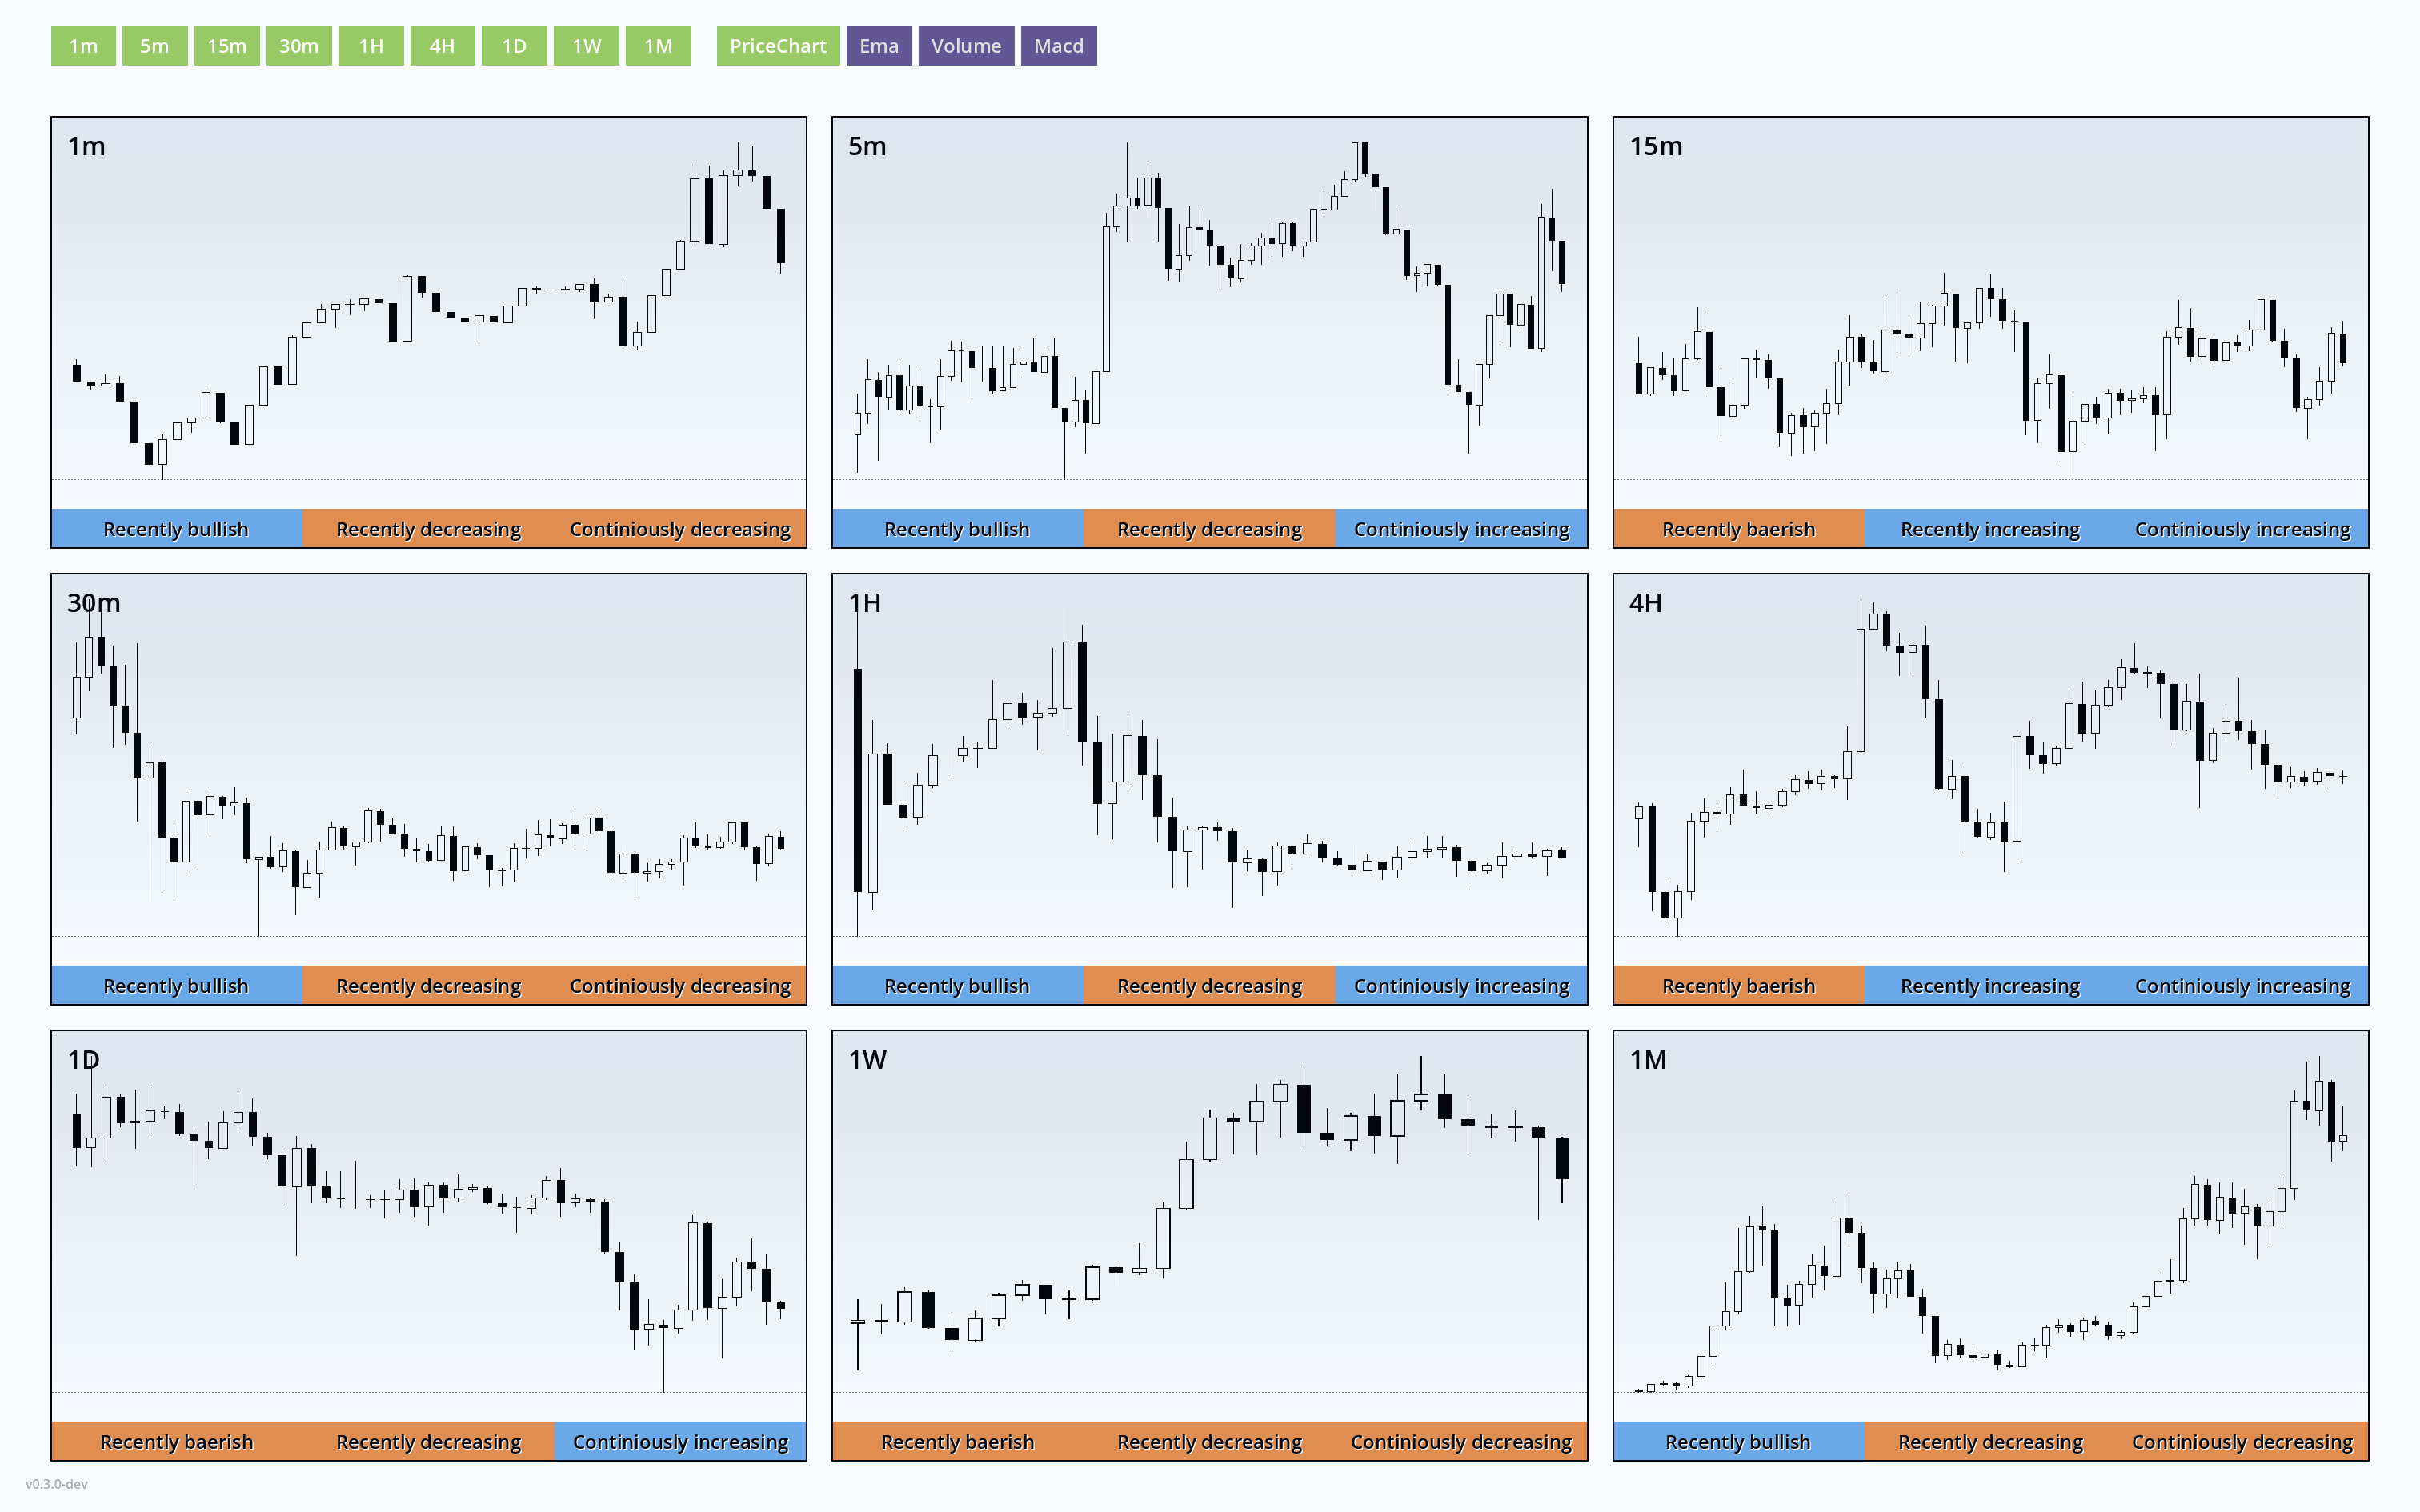
My intention with the Trading Helper is to have things more condensed and less bloated with lots of numbers and UI elements and whatever else you can find on TV or on your broker’s chart implementation. My intention is to keep an easier overview of several things, especially of multiple timeframes at once (e.g. having a look at MACD indicator in different timeframes simultaneously).
I can tell, though, that I plan to add a few more indicators in the future (which is why I am reworking a lot of the UI right now and especially things below the surface).
So, I don’t want to add such tools for drawing custom lines and stuff like that. But I have in mind to add more tools that are supposed to help you finding potential market entries and to determine where to set stop-losses and such kind of things.
Not sure if this will work out but it’s what I have in mind and worth a try.
To sum things up here’s my “master plan” for the Trading Helper:
In the short-term I want to add more indicators, make them customizable in terms of change some of their inputs (basically the same as in TV). This will take a few more weeks or months even, I guess … Let’s say: It will take as much time as it takes, probably until I am satisfied. 😅
In the mid-term I want to add some sort of rules that I can define to implement simple strategies which then should help me find potential entries into the market, as mentioned earlier. I can imagine some alarms or a notification system, or simply markers being drawn into the chart, something like that.
In the long-term I have the vision of the tool being capable of entering the market automatically even and realizing losses and profits on its own to make the tool a trading bot, so to speak.